



The reason is simple: more funds don’t diversify portfolios, drivers do. When you dissect what sits inside many major equity indices, you often find a familiar pattern: a heavy tilt to the same leading sectors and themes, creating hidden concentration risk.
This is where real assets can play a valuable role, helping investors add exposures that are tied to different economic forces and cash-flow characteristics, potentially improving a portfolio’s resilience through different market environments.
Why “diversified” portfolios can be overconcentrated?
Many investors equate diversification with simply owning more funds or more regions. But if those holdings are ultimately driven by the same market forces, such as global growth expectations, equity risk appetite, or the performance of a narrow set of mega-cap leaders, then the portfolio may be diversified in name only.
One practical way to spot this is to look at correlations. When holdings rise and fall together, the portfolio may not be gaining meaningful diversification. Adding a block of real assets can exhibit meaningfully lower correlations to major U.S., global and emerging market equity indices. This suggests that a real assets strategy may help investors move beyond surface-level diversification and add exposure to different return drivers tied to real assets, income and the real economy.
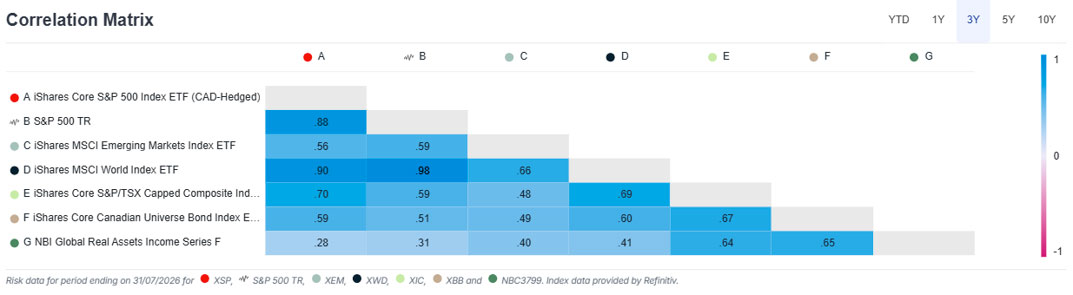
Source: Capintel. Period of 3 years as of July 31, 2026.
The “index overlap” problem
Investors often combine multiple equity building blocks like U.S., global developed and emerging markets, to spread risk. But broad indices can still share similar sector leadership (e.g., Information technology), overlapping factor exposures (growth, momentum, quality), global mega-cap influence (large companies can dominate index outcomes) and increased co-movement during volatile periods.
The result is a portfolio that appears diversified but can still draw down like a single risk bucket when markets get stressed.
Under the hood: Sector concentration
If you dissect the top sector holdings of major indices, a common pattern emerges: a small number of large sectors often dominate returns and the dominant sectors can look surprisingly similar across different “diversified” equity allocations.
| Index | Financials | Energy | Materials | Industrials | Information Technology | Utilities | Consumer Staples | Consumer Discretionary | Communication Services | Real Estate | Health Care |
|---|---|---|---|---|---|---|---|---|---|---|---|
| S&P/TSX Composite Index | 36.1% |
17.4% |
15.6% |
10.5% |
7.2% |
3.6% |
3.3% |
3.1% |
1.6% |
1.3% |
0.3% |
| MSCI EAFE Index | 26.5% |
3.8% |
5.9% |
19.0% |
10.0% |
3.8% |
6.8% |
8.4% |
3.8% |
1.6% |
10.2% |
| MSCI World Index | 16.8% |
4.0% |
3.2% |
11.5% |
28.7% |
2.5% |
5.1% |
9.0% |
8.1% |
1.7% |
9.1% |
| MSCI Emerging Markets Index | 20.0% |
3.5% |
5.8% |
6.5% |
40.8% |
2.0% |
2.8% |
8.6% |
6.6% |
1.0% |
2.6% |
| S&P 500 Index | 12.3% |
3.3% |
1.8% |
8.7% |
36.5% |
2.1% |
4.6% |
9.4% |
9.9% |
1.9% |
9.1% |
Source: Factset as of July 31, 2026
Why does this matter?
Because sector concentration is not just a portfolio construction detail, it’s a risk exposure. When the same sectors dominate multiple holdings, portfolio outcomes become more dependent on a narrower set of macro drivers such as interest-rate sensitivity, earnings concentration among a few industries, valuation risk when a popular sector becomes crowded and regulatory or geopolitical headwinds affecting specific industries
In other words, owning multiple products that track indices doesn’t guarantee multiple return engines. Yet, in moments where volatility spikes or there are market drawdowns, “diversified” equity sleeves often move more closely together. This is the real diversification challenge today as it’s not about owning more line items. It’s about owning exposures that respond differently to economic conditions.
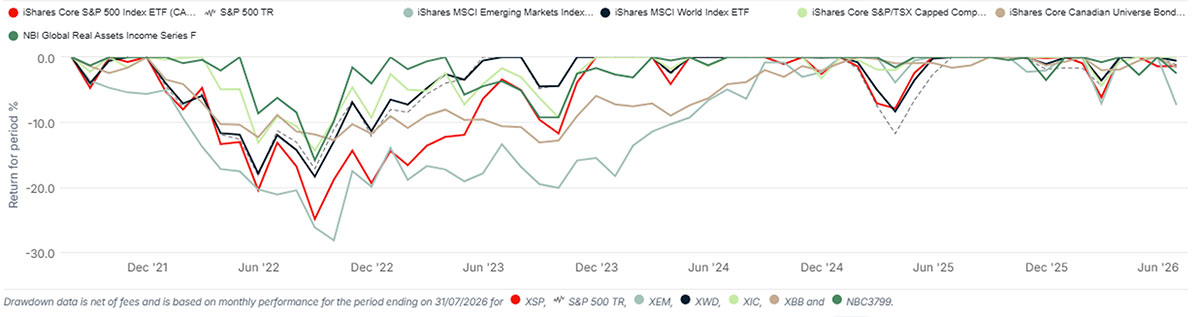
Source: Capintel. Drawdown on a 5-year basis.
Where real assets play a role in diversification
Real assets typically refer to assets tied to the real economy, often with tangible or infrastructure-like characteristics, such as:
- Infrastructure-related businesses and assets
- Real estate–linked cash flows
- Utilities and essential services
- Energy and resource-related assets
Benefit #1: A different return engine
Instead of being dominated by the same “top sector” leadership cycle, real assets can introduce exposure to cash-flowing segments tied to real-world demand and, in some strategies, contract-based revenue profiles.
Benefit #2: Potential drawdown management
A core objective for many real asset income strategies is not to “win every month,” but to improve the ride, seeking more resilient outcomes during volatile periods.
Benefit #3: Income that complements traditional sources
In many portfolios, “income” often means bonds. But bond outcomes can be challenged when rates rise or when duration exposure becomes uncomfortable for clients. A real assets income sleeve can provide an additional income-oriented exposure that is not purely driven by the same rate dynamics as traditional fixed income.
Benefit #4: Better behavioral outcomes
This point is often overlooked. The best portfolio is the one investor can stick with. Portfolios that experience sharper drawdowns can trigger emotional decisions such as selling low, abandoning plans, and reducing long-term outcomes. A smoother path of returns can support better investor behavior over full cycles.
Diversification deserves an upgrade
The takeaway is not that indices are bad or that traditional building blocks don’t work. Its that modern portfolios can unintentionally become concentrated, because major indices can share similar sector tilts and performance drivers, even across different regions and “styles.”
That’s why real assets deserve a place in the diversification conversation. They can help investors move beyond surface-level diversification and toward driver-level diversification. This enhances exposures that may behave differently across inflation, volatility, and changing economic regimes.